中国药学(英文版) ›› 2019, Vol. 28 ›› Issue (5): 298-315.DOI: 10.5246/jcps.2019.05.030
刘慧1, 梁磊1*, 袁兰2*, 许凤荣1, 牛彦1, 王超1, 徐萍1*
Hui Liu1, Lei Liang1*, Lan Yuan2*, Fengrong Xu1, Yan Niu1, Chao Wang1, Ping Xu1*
摘要:
中图分类号:
Supporting:
Content
1. Density functional theory calculations
2. Photophysical properties
3. Live cell imaging
4. NMR data of isolated compounds
5. HRMS data of isolated compounds
6. Reference
1. Density functional theory calculations
Table S1. Calculated total energy of optimized structures for compounds PH, PY and 4a-4c.
.jpg)
Table S2. Atom coordinates for the optimized geometry of PH.
.jpg)
Table S3. Atom coordinates for the optimized geometry of PY.
.jpg)
Table S4. Atom coordinates for the optimized geometry of 4a.
.jpg)
Table S5. Atom coordinates for the optimized geometry of 4b.
.jpg)
Table S6. Atom coordinates for the optimized geometry of 4c.
.jpg)
2. Photophysical properties
Table S7. Structure and photophysical properties of PH, PY and 4a-4c in different solvents. [a]
.jpg)
[a] All data were measured at 298K. [b] λmax values of the one-photon absorption and emission spectra in nm. [c] Stokes shift.
Determination of the absorption spectra of PH, PY and 4a-4c in DMSO
.jpg)
Figure S1. Normalized absorption spectra of compounds in DMSO.
Determination of the fluorescence properties of PH, PY and 4a-4c in different solvents
.jpg)
Figure S2. Normalized fluorescence excitation and emission spectra of compounds in DMSO.
.jpg)
Figure S3. Normalized fluorescence excitation and emission spectra of compounds in EtOH.
.jpg)
Figure S4. Normalized fluorescence excitation and emission spectra of compounds in PBS.
Table S8. Structure and photophysical properties of probes 6a-6c and 7a-7c in different solvents. [a]
.jpg)
[a] All data were measured at 298K. [b] λmax values of the one-photon absorption and emission spectra in nm. [c] Stokes shift.
Determination of the absorption spectra of 6a-6c and 7a-7c in DMSO
.jpg)
Figure S5. Normalized absorption spectra of compounds in DMSO.
Determination of the fluorescence properties of 6a-6c and 7a-7c in different solvents
.jpg)
Figure S6. Normalized fluorescence excitation and emission spectra of compounds in DMSO.
.jpg)
Figure S7. Normalized fluorescence excitation and emission spectra of compounds in EtOH.
.jpg)
Figure S8. Normalized fluorescence excitation and emission spectra of compounds in PBS.
3. Live cell imaging
3.1 Cytotoxicity assay
.jpg)
Figure S9. MTT assay results of nitrogen-fused pyridazinone compounds (6a-6c and 7a-7c). Cells were incubated with different concentrations (0.5/1/2/4/6 μM) of compounds.
4. NMR data of isolated compounds
1H and 13C NMR spectra of compound 2a
.jpg)
1H and 13C NMR spectra of compound 2b
.jpg)
1H and 13C NMR spectra of compound 2c
.jpg)
1H and 13C NMR spectra of compound 3a
.jpg)
1H and 13C NMR spectra of compound 3b
.jpg)
1H and 13C NMR spectra of compound 3c
.jpg)
1H and 13C NMR spectra of compound 4a
.jpg)
1H and 13C NMR spectra of compound 4b
.jpg)
1H and 13C NMR spectra of compound 4c
.jpg)
1H and 13C NMR spectra of compound 5a
.jpg)
1H and 13C NMR spectra of compound 5b
.jpg)
1H and 13C NMR spectra of compound 5c
.jpg)
1H and 13C NMR spectra of compound 6a
.jpg)
1H and 13C NMR spectra of compound 6b
.jpg)
1H and 13C NMR spectra of compound 6c
.jpg)
1H and 13C NMR spectra of compound 7a
.jpg)
1H and 13C NMR spectra of compound 7b
.jpg)
1H and 13C NMR spectra of compound 7c
.jpg)
5. HRMS data of isolated compounds
HRMS spectra of compound 2a
.jpg)
HR-MS spectra of compound 2b
.jpg)
HRMS spectra of compound 2c
.jpg)
HRMS spectra of compound 3a
.jpg)
HR-MS spectra of compound 3b
.jpg)
HRMS spectra of compound 3c
.jpg)
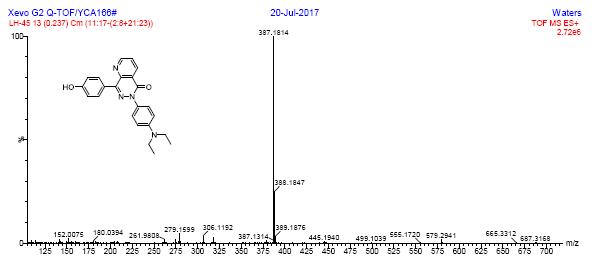
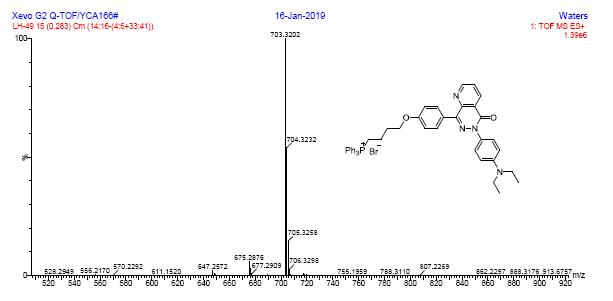
HRMS spectra of compound 4a
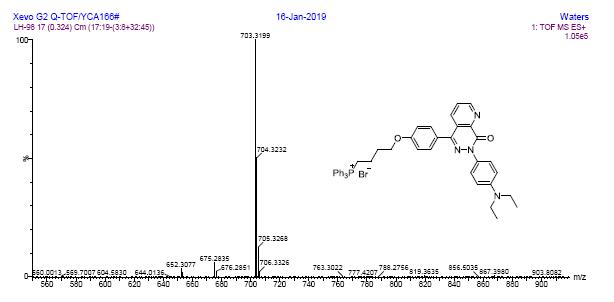
HR-MS spectra of compound 4b
.jpg)
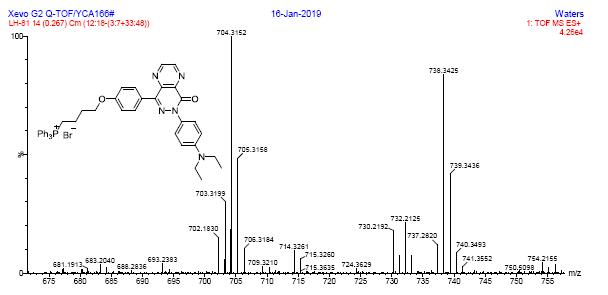
HRMS spectra of compound 4c
.jpg)
HRMS spectra of compound 5a
.jpg)
HR-MS spectra of compound 5b
.jpg)
HRMS spectra of compound 5c
.jpg)
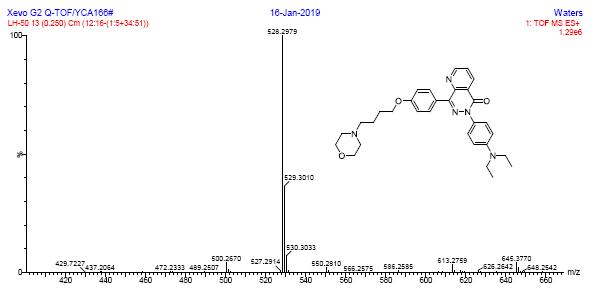
HRMS spectra of compound 6a
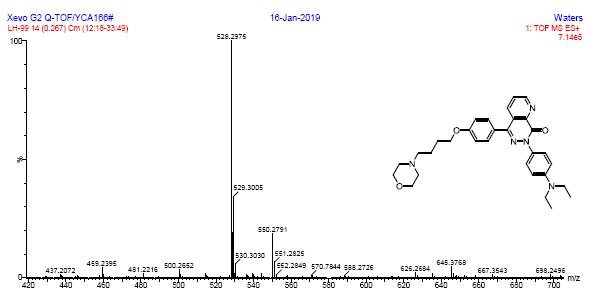
HRMS spectra of compound 6b
1HRMS spectra of compound 6c
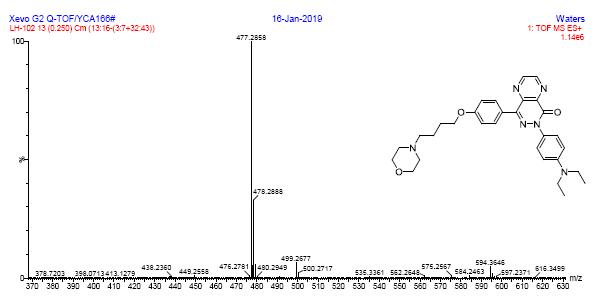
HRMS spectra of compound 7a
HRMS spectra of compound 7b
HRMS spectra of compound 7c
6. Reference
[1] See ref [20].

 >
> >
>